Abstract:
Bovine mastitis is an inflammation of the udder tissue of the mammary gland brought on
by microbial infections or physical damage. It is characterised by physical, chemical, and biological
changes in the udder and milk. While several different bacterial species have been identified as
causative agents of mastitis, many subclinical mastitis (SCM) cases remain culture-negative. The
aim of this study was to characterise milk microbiota from SCM and apparently healthy dairy cows
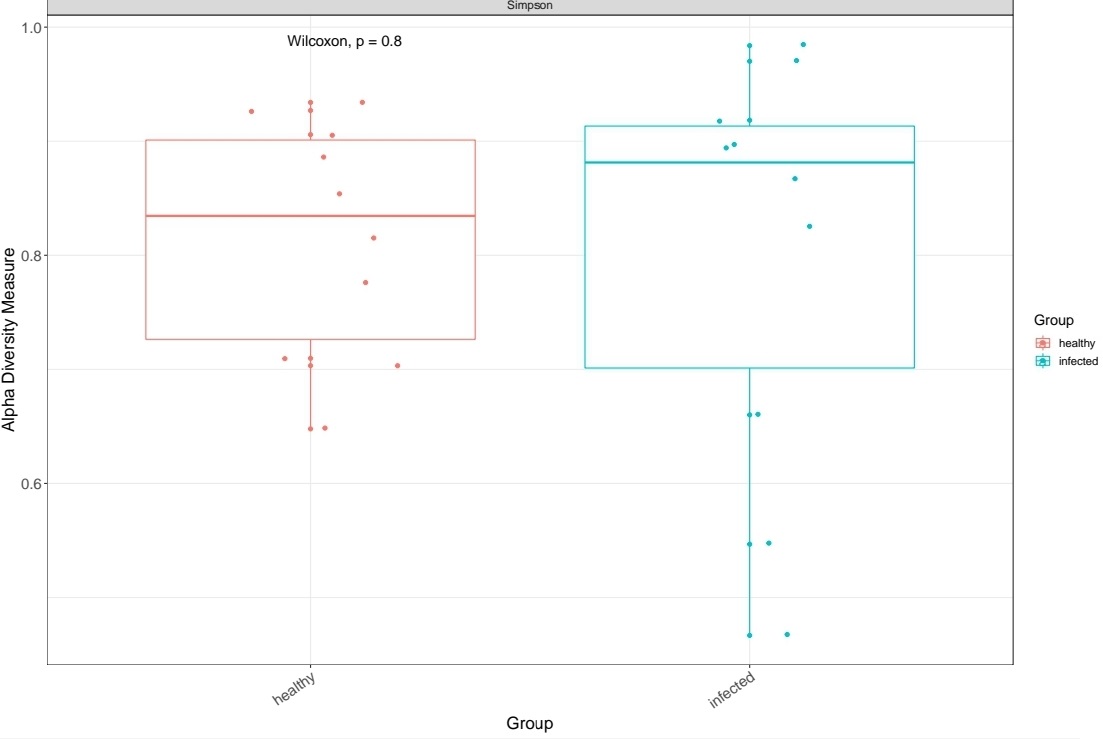
(non-SCM) by 16S rRNA sequencing. Alpha-diversity metrics showed significant differences between
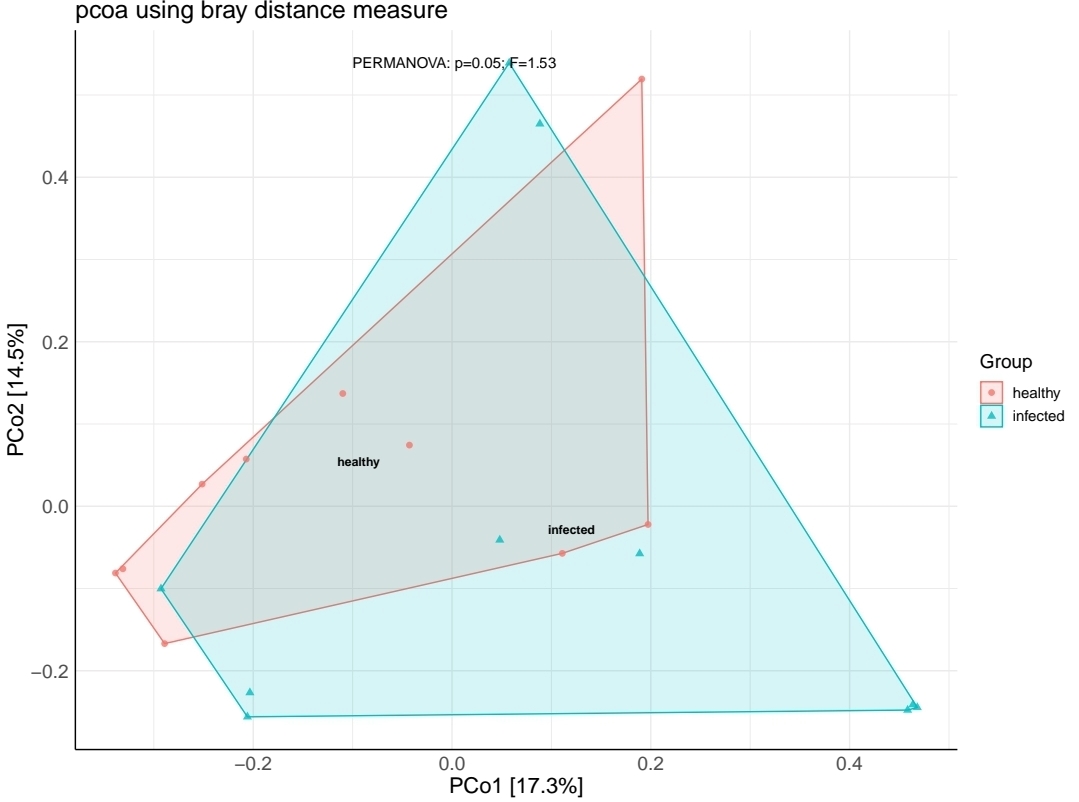
SCM cows and non-SCM counterparts. The beta-diversity metrics in the principal coordinate analysis
significantly clustered samples by type (PERMANOVA test, p < 0.05), while non-metric dimensional
scaling did not (PERMANOVA test, p = 0.07). The overall analysis indicated a total of 95 phyla,
33 classes, 82 orders, 124 families, 202 genera, and 119 bacterial species. Four phyla, namely Actinobacteriota,
Bacteroidota, Firmicutes, and Proteobacteria collectively accounted for more than 97%
of all sequencing reads from SCM and non-SCM cow samples. The most abundant bacterial classes
were Actinobacteria, Bacilli, Bacteroidia, Clostridia, and Gammaproteobacteria in non-SCM cow
samples, whilst SCM cow samples were mainly composed of Actinobacteria, Alphaproteobacteria,
Bacilli, Clostridia, and Gammaproteobacteria. Dominant bacterial species in non-SCM cow samples
were Anthropi spp., Pseudomonas azotoformans, P. fragi, Acinetobacter guillouiae, Enterococcus italicus,
Lactococcus lactis, whilst P. azotoformans, Mycobacterium bovis, P. fragi, Acinetobacter guillouiae, and
P. koreensis were dominant in the SCM cow samples. The current study found differences in bacterial
species between SCM and non-SCM cow milk; hence, the need for detailed epidemiological studies.
Description:
SUPPLEMENTARY MATERIALS : TABLE S1: Read counts tracked through the DADA2 pipeline including ASV counts, richness, and genus-level resolved ASVs per sample. TABLE S2: Taxonomic profiling of reference sample. FIGURE S1: Alpha diversity boxplots showing Chao1 richness estimates (p = 0.47). FIGURE S2: Alpha diversity box = plots showing ACE indicators per group (SCM and Healthy cows) (p = 0.28). FIGURE S3: Alpha diversity boxplots showing Shannon’s diversity (p = 0.58). FIGURE S4: Alpha diversity boxplots showing Simpson’s diversity estimates (p = 0.8). FIGURE S5: Beta diversity of NMDS analysis of healthy and SCM groups (p = 0.07; F = 1.53). FIGURE S6: Shows principle co-ordinated analysis against SCM and heathy groups * (p = 0.05; F = 1.53).
DATA AVAILABILITY STATEMENT : The data used to support the findings of this study are available in the present manuscript.