- UPSpace Home
- →
- Natural and Agricultural Sciences
- →
- Genetics
- →
- Research Articles (Genetics)
- →
- View Item
JavaScript is disabled for your browser. Some features of this site may not work without it.
| dc.contributor.author | Delhomme, Nicolas
|
|
| dc.contributor.author | Sundstrom, Gorel
|
|
| dc.contributor.author | Zamani, Neda
|
|
| dc.contributor.author | Lantz, Henrik
|
|
| dc.contributor.author | Lin, Yao-Cheng
|
|
| dc.contributor.author | Hvidsten, Torgeir R.
|
|
| dc.contributor.author | Hoppner, Marc P.
|
|
| dc.contributor.author | Jern, Patrick
|
|
| dc.contributor.author | Van de Peer, Yves
|
|
| dc.contributor.author | Lundeberg, Joakim
|
|
| dc.contributor.author | Grabherr, Manfred G.
|
|
| dc.contributor.author | Street, Nathaniel R.
|
|
| dc.contributor.editor | Arthofer, Wolfgang | |
| dc.date.accessioned | 2015-11-23T07:40:58Z | |
| dc.date.available | 2015-11-23T07:40:58Z | |
| dc.date.issued | 2015-09-28 | |
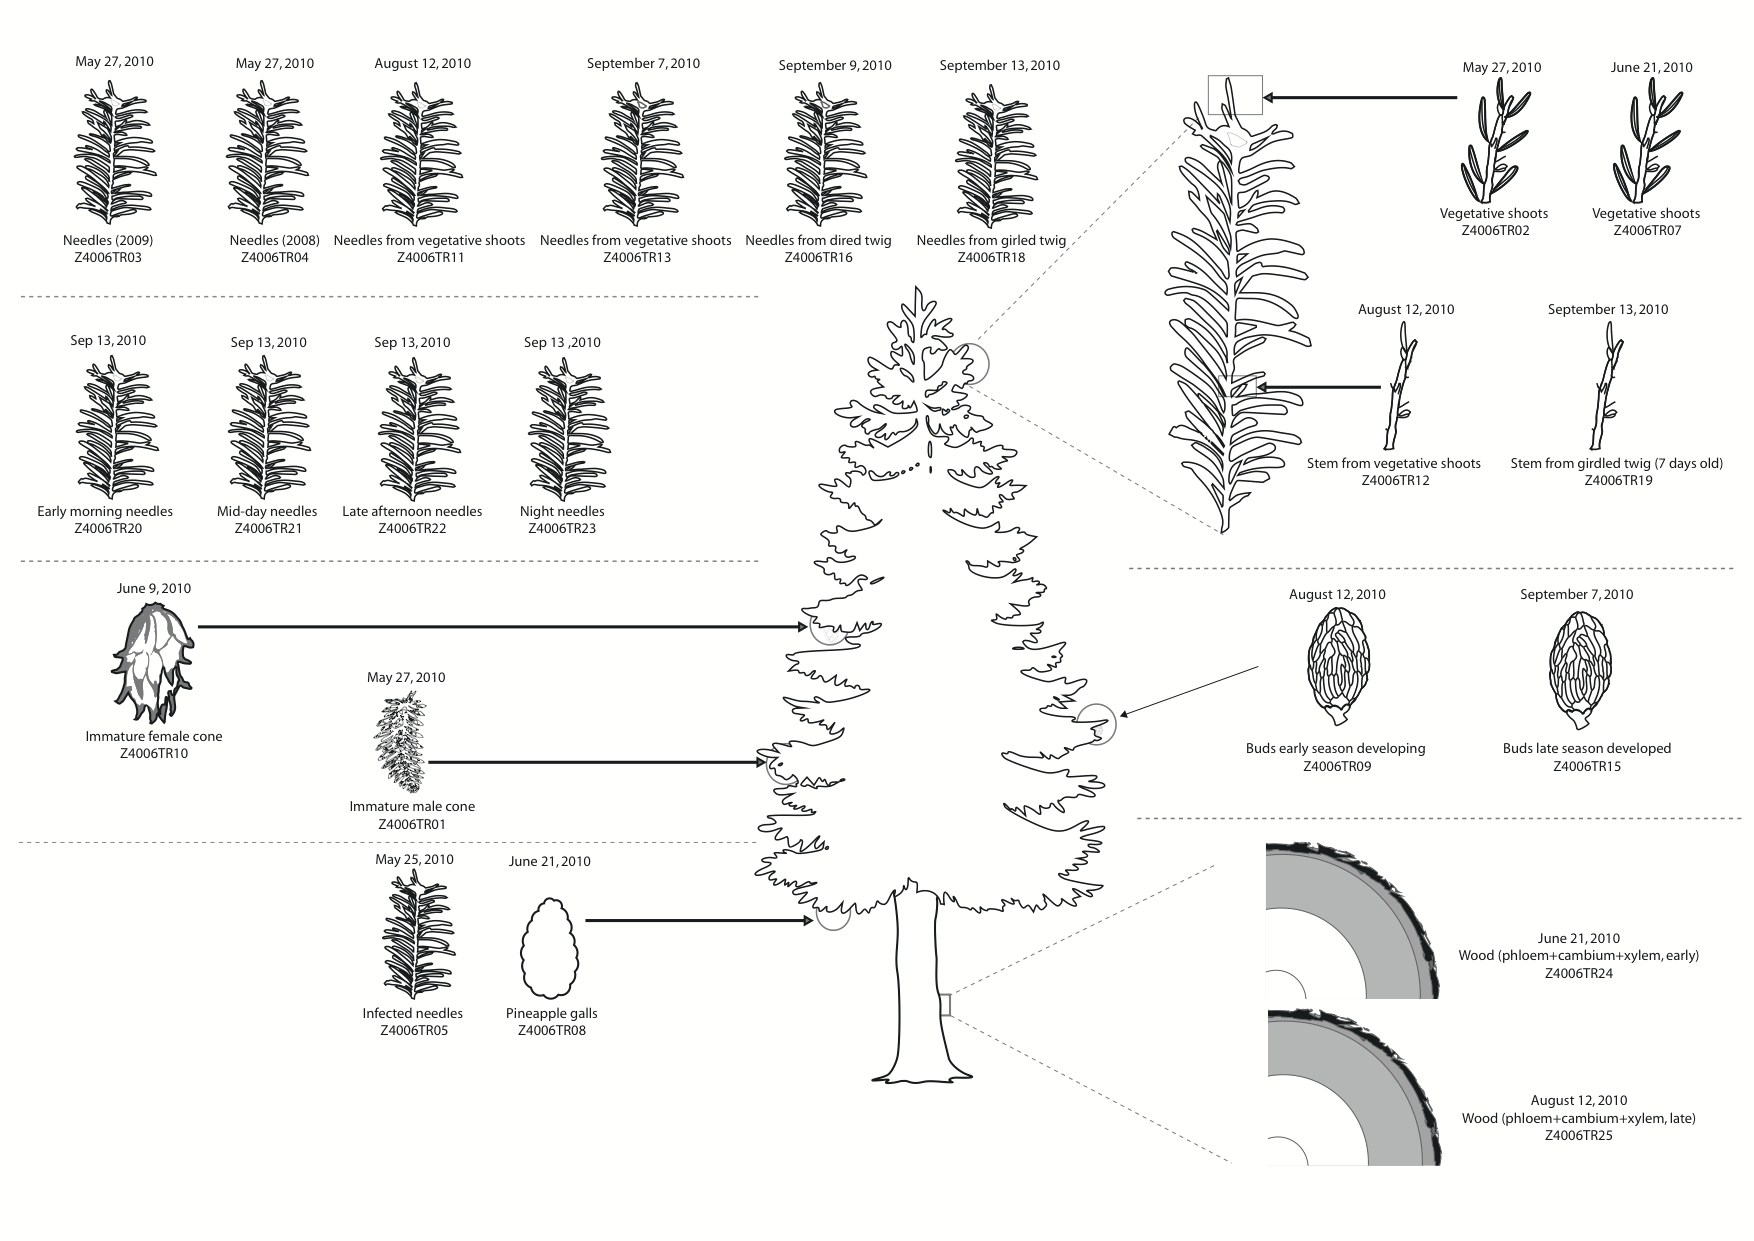
| dc.description | S1 Fig. Samples collected from Norway spruce. For each sample a brief description and sample ID are shown below a representative image of the associated plant tissue, while the sampling date is shown above. | en_ZA |
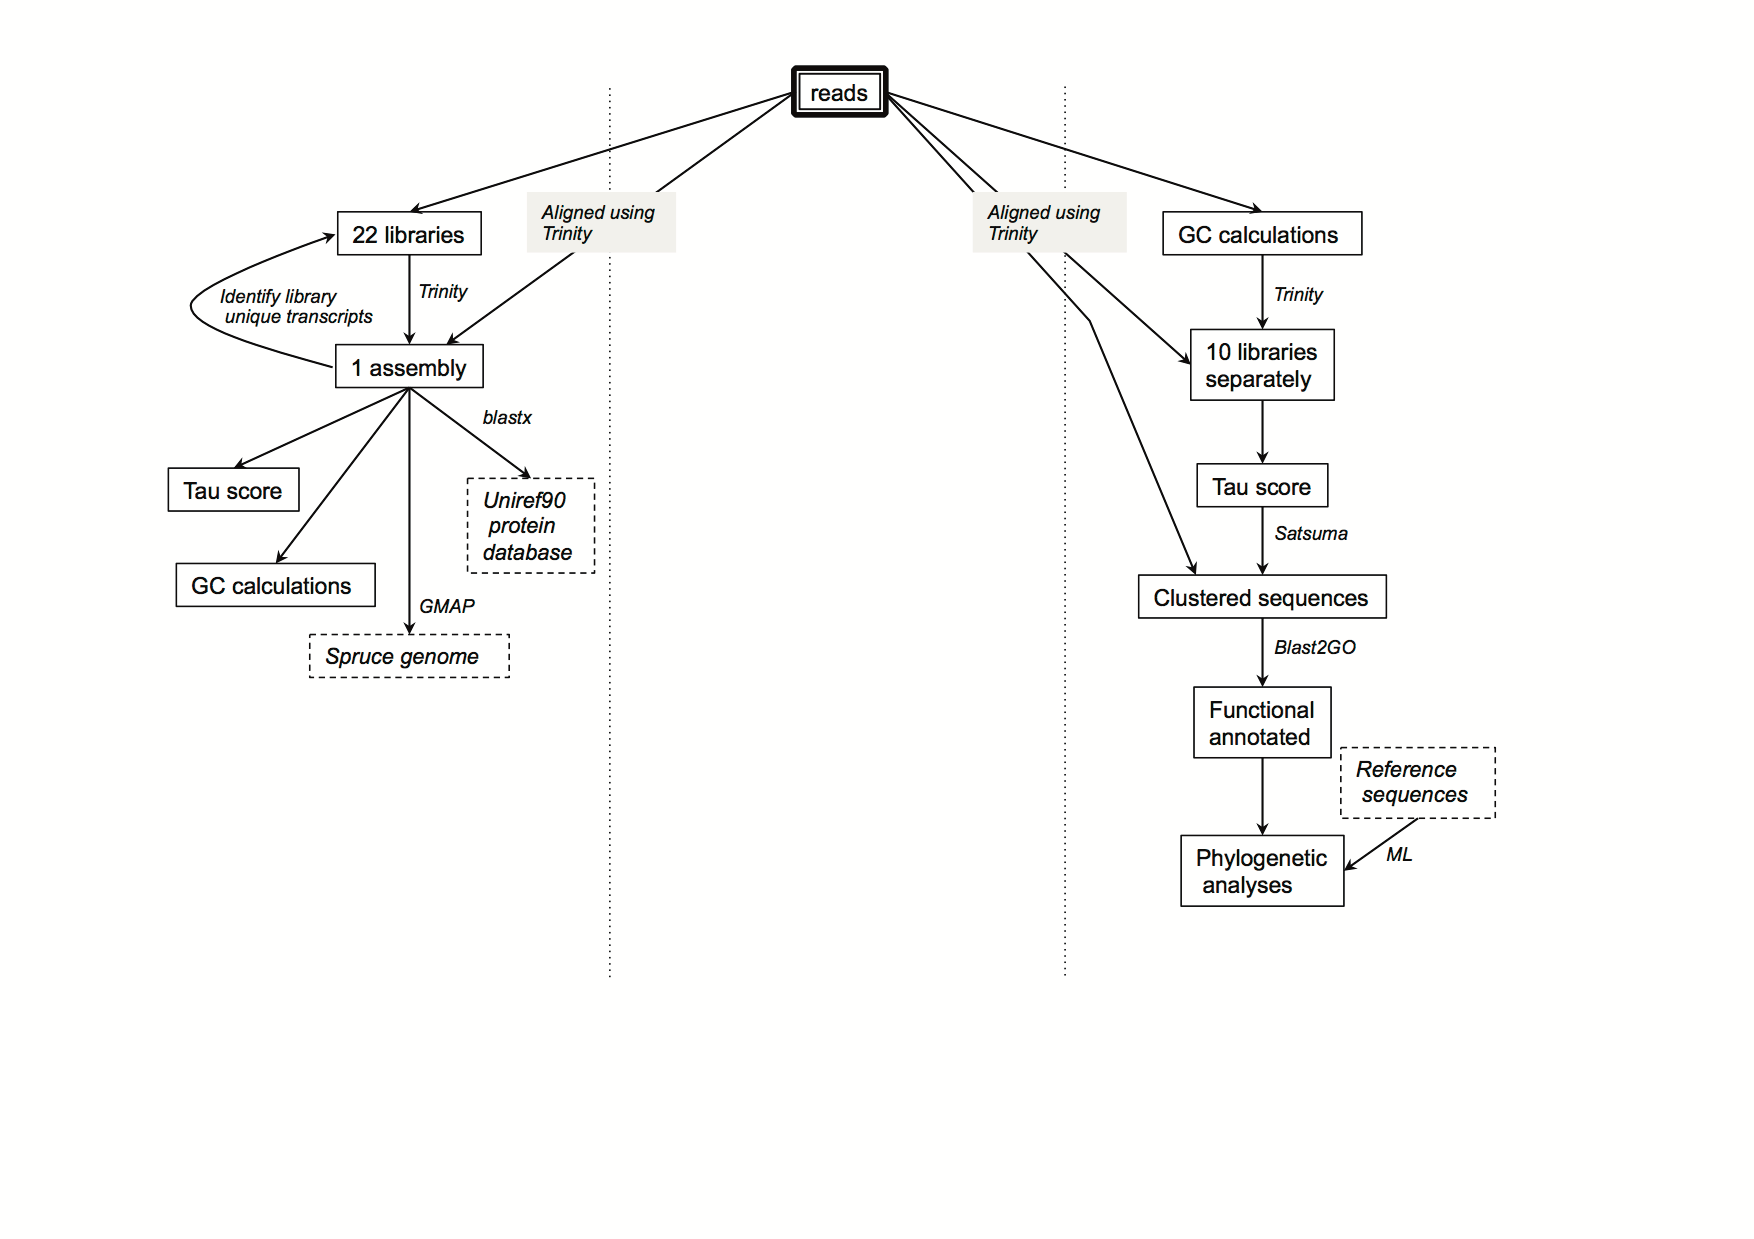
| dc.description | S2 Fig. Bioinformatics workflow of RNA data processing. We assembled reads from all samples into a single assembly (left column), computed Tau scores, GC content, and mapped the transcripts to the genome as well as to the Uniref90 protein database. For enriching for fungal transcripts (right column), we applied GC content and expression breadth filters to the reads and assembly respectively, clustered sequences by similarity, and performed functional annotation as well as phylogenetic analyses. | en_ZA |
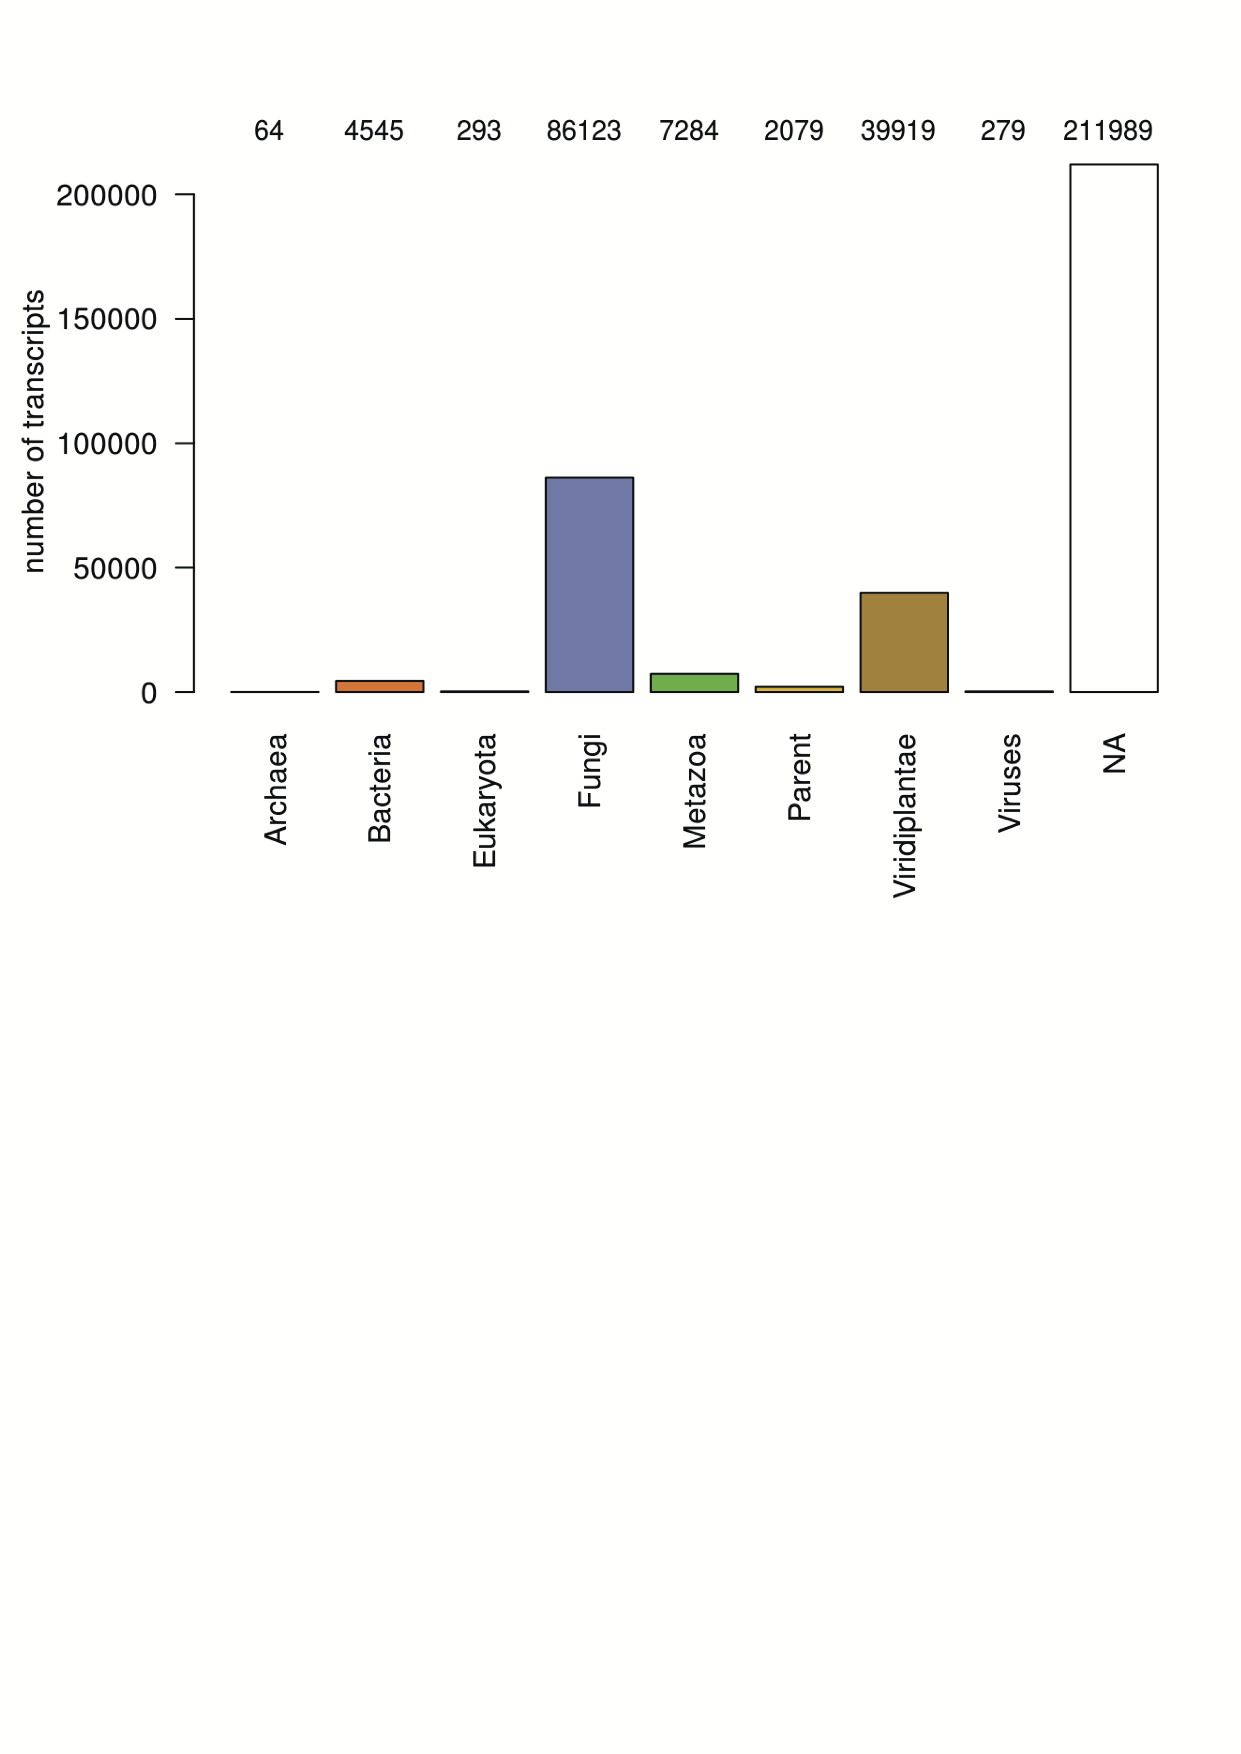
| dc.description | S3 Fig. Putative taxonomic characterization of transcripts via protein alignments. Bar plot showing the number of transcripts by taxonomy (super)kingdoms. Parent summarises taxons hierarchically higher than the represented (super)kingdoms, NA summarises transcripts with no sequence similarity in the UniRef90 database. The number of transcripts is indicated at the top of every bar. | en_ZA |
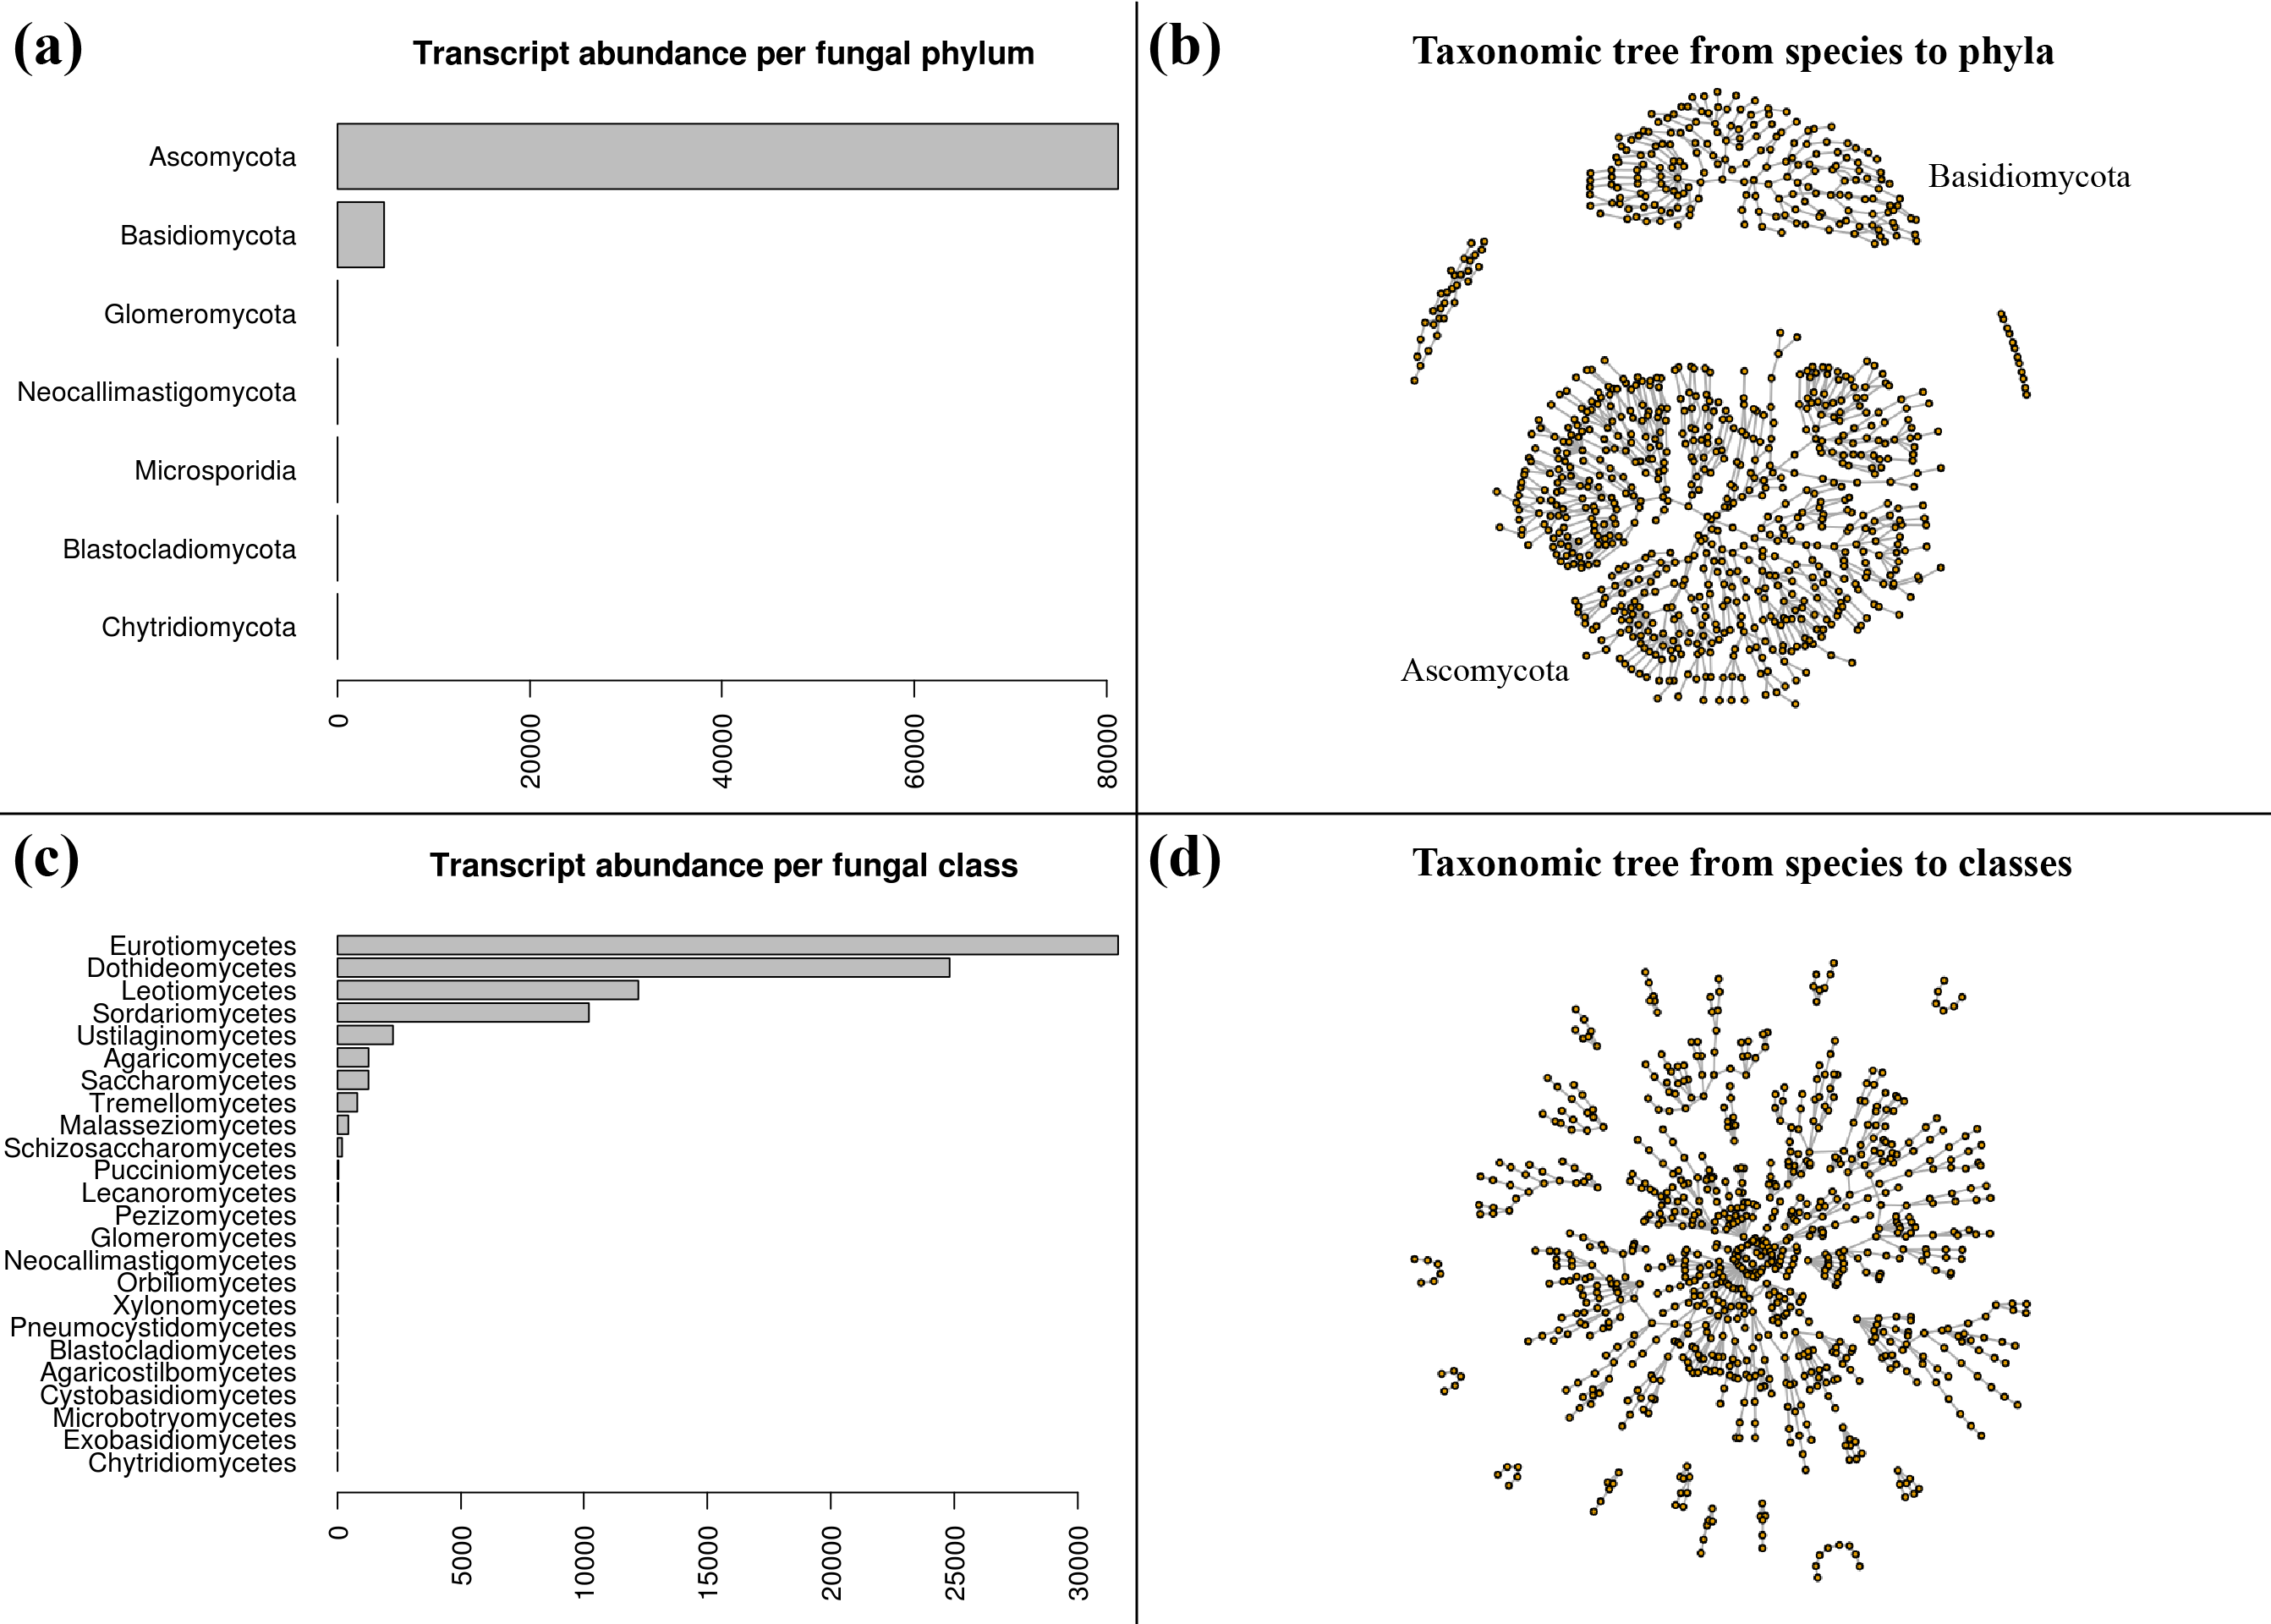
| dc.description | S4 Fig. Taxonomic class and phylum of the fungal transcripts. (a) Number of transcripts per fungal phylum. The phylum are sorted by abundance top to bottom with Ascomycota (n = 81,181) and Basidiomycota (n = 4,839) being the most represented; the remaining phyla varying from n = 11 to n = 2. (b) A graph of the taxonomic hierarchy from species to phylum of the fungal transcripts, showing the broad species diversity of the largest clusters: Ascomycota (bottom) and Basidiomycota (top). (c) Similar to (a) for the fungal classes, with the Eurotiomycetes and Dothideomycetes classes being over-represented among the fungal transcripts. (d) Similar to (b) for the fungal classes (n = 24). | en_ZA |
| dc.description | S5 Fig. Characterisation of transcripts lacking taxonomic assignment by their GMAP alignments to the P. abies genome. (a) Boxplot of the tau scores for the no taxon transcripts split based on their GMAP alignments to the P. abies genome. The tau score ranges from 1 for complete specificity to 0 for equal expression in all samples. The transcripts having a GMAP alignment in the genome (99% of the GMAP hits cover 80% of the transcripts with at least a 90% identity) show a wide tau score distribution indicative of the presence of ubiquitously expressed transcripts as well as that of more tissue-specific transcripts. The transcripts having no GMAP alignment show a distribution typical of only tissue-specific expression (mean tau score of 0.98). (b) Percentage GC density distribution of the no taxon transcripts split based on their GMAP alignments to the P. abies genome. Transcripts having a GMAP alignment to the genome present a GC distribution typical of the P. abies transcripts. The transcripts without a GMAP alignment show a distribution enriched for higher percentage GC, similar to that of fungi. The shoulder observed under the peak of transcripts with GMAP alignments may indicate transcripts where the assembly contained gaps or created chimeras. (c) Scatterplot of log2 FPKM expression values vs. the percentage GC content for the transcripts with a GMAP alignment. Colouring indicates density, which is shaded from yellow (high) to blue (low). The expression of transcripts with a GMAP alignment resembles that of the Embryophita phylum. (d) Scatterplot of log2 FPKM expression values vs. the percentage GC content for transcripts with a GMAP alignment. Colouring as in (c). The expression of transcripts with no GMAP alignment resembled that of the fungal kingdom. | en_ZA |
| dc.description | S6 Fig. Phylogeny built on four nuclear genes. Shown are maximum-likelihood phylogenies based on fungal nucleotide sequences assembled from the spruce samples in context of known sequences, with highest sequence similarity to: (a) phosphoenolpyruvate carboxykinase; (b) NADP-dependent medium chain alcohol dehydrogenase; (c) beta lactamase; and (d) unspecific lipid transporter. Only branch with support values > 0.9 are shown. While clusters with more representative sequences yield better branch support (a, b), placement of clusters with fewer sequences is less certain (c, d). However, in all cases, at least one sequence is grouped with Dothideomycetes, and for (a,b) with Leotiomycetes. | en_ZA |
| dc.description | S1 Table. Sample IDs, description, and ENA submission IDs. Correspondence between the sample IDs as described in Nystedt et al., (2013), this manuscript and the ENA are shown in columns one to three. The fourth column contains a succinct description of the samples, refer to Nystedt et al., (2013) for full details. | en_ZA |
| dc.description.abstract | After performing de novo transcript assembly of >1 billion RNA-Sequencing reads obtained from 22 samples of different Norway spruce (Picea abies) tissues that were not surface sterilized, we found that assembled sequences captured a mix of plant, lichen, and fungal transcripts. The latter were likely expressed by endophytic and epiphytic symbionts, indicating that these organisms were present, alive, and metabolically active. Here, we show that these serendipitously sequenced transcripts need not be considered merely as contamination, as is common, but that they provide insight into the plant’s phyllosphere. Notably, we could classify these transcripts as originating predominantly fromDothideomycetes and Leotiomycetes species, with functional annotation of gene families indicating active growth and metabolism, with particular regards to glucose intake and processing, as well as gene regulation. | en_ZA |
| dc.description.librarian | am2015 | en_ZA |
| dc.description.uri | http://www.plosone.org | en_ZA |
| dc.identifier.citation | Delhomme N, Sundström G, Zamani N, Lantz H, Lin Y-C, Hvidsten TR, et al. (2015) Serendipitous Meta-Transcriptomics: The Fungal Community of Norway Spruce (Picea abies). PLoS ONE 10(9): e0139080. DOI: 10.1371/journal.pone.0139080. | en_ZA |
| dc.identifier.issn | 1932-6203 | |
| dc.identifier.other | 10.1371/journal.pone.0139080 | |
| dc.identifier.uri | http://hdl.handle.net/2263/50582 | |
| dc.language.iso | en | en_ZA |
| dc.publisher | Public Library of Science | en_ZA |
| dc.rights | © 2015 Delhomme et al. This is an open access article distributed under the terms of the Creative Commons Attribution License. | en_ZA |
| dc.subject | De novo | en_ZA |
| dc.subject | Norway spruce | en_ZA |
| dc.subject | Sequenced transcripts | en_ZA |
| dc.subject | Gene regulation | en_ZA |
| dc.title | Serendipitous meta-transcriptomics : the fungal community of Norway Spruce (Picea abies) | en_ZA |
| dc.type | Article | en_ZA |